Google said our site was not effective on mobile. The counters were to blame
Search Console flagged 102 not-effective addresses on mobile for our own site — and the same 102 green on desktop. The first hypothesis, a background animation, did not survive measurement. The culprits were the ad tags, and the costliest detail a second copy of the same 189 KB library. A full walkthrough with numbers and a six-step instruction.
Search Console lit up for our own site: 102 addresses "not effective" on mobile — and the very same 102 green on desktop. One site, one layout, two verdicts. We dug in, the first obvious hypothesis turned out to be wrong, and the culprit was something that sits on almost every site and that owners rarely think of as part of the site at all. Below is the whole investigation with measurements, and an instruction for checking and fixing your own.
What Google actually measures
The metric is INP — Interaction to Next Paint. Google describes it like this:
"INP is a metric that assesses a page's overall responsiveness to user interactions by observing the latency of all click, tap, and keyboard interactions that occur throughout the lifespan of a user's visit to a page."
Thresholds: good is 200 ms or less, needs improvement is 200 to 500 ms, poor is above 500 ms.
web.dev, INP documentationThe key thing for an owner to grasp: INP does not measure loading speed. It measures how long it takes from a tap until the screen visibly responds. A page can open in a second and still be "not effective" if, once open, it is busy with itself and cannot answer a finger.
And the second important thing: this is a field metric. Google collects it from real visitors, not from a lab test. So the report updates with a lag and over a rolling window — there will be no instant green after a fix.
Why mobile is red while desktop is green
The answer is boring and fully explains the gap: a phone's processor is four to eight times slower than a desktop one. The same chunk of work that takes 60 ms on a laptop and passes unnoticed stretches to 300–500 ms on a phone — and the person already sees the button "sticking". The layout has nothing to do with it: the code is identical, only the speed of running it differs.
The first hypothesis was wrong
Our home page has a background animation, and suspicion fell on it immediately — the way it will for most owners: "something on the site is moving, so that is what is slowing it down." Instead of switching it off and hoping, we measured three variants of the same screen: as is, with the animation off, and with third-party tags blocked.
What we measured was not a feeling but a specific quantity — main-thread blocking time: the sum of how much long tasks exceed 50 ms. While such a task runs, the browser cannot answer a tap, and this is exactly what INP is made of.
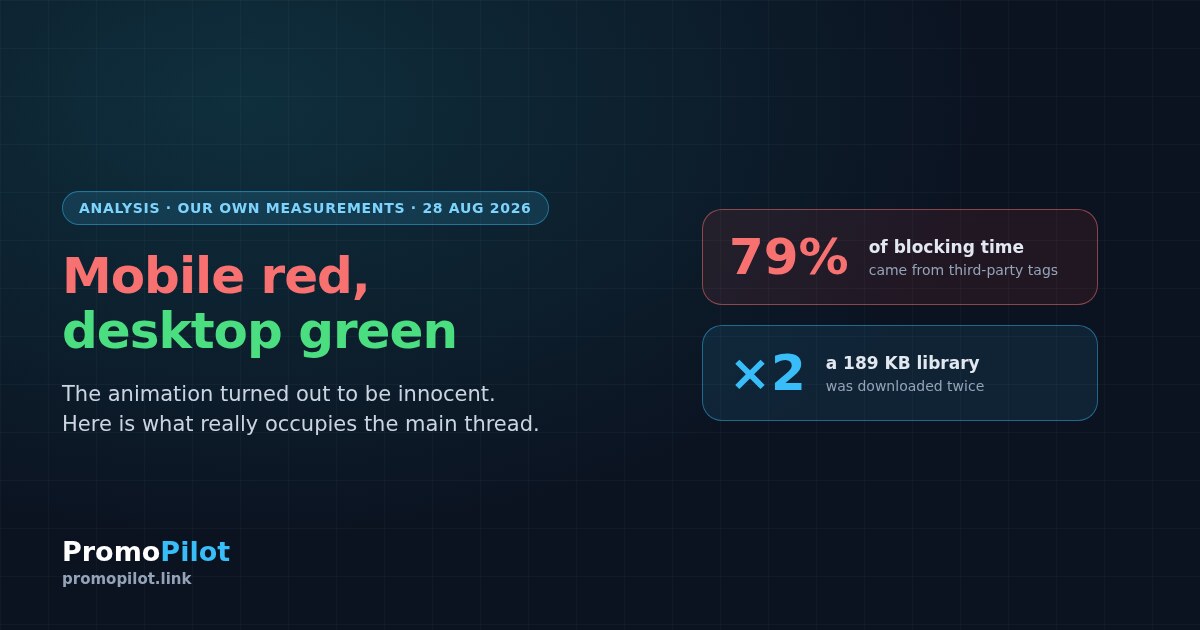
The result settled the question. Turning off the animation gave nothing — 1840 ms against 1782 ms as is, a difference within the noise and formally even worse. Blocking third-party tags, meanwhile, cut blocking time from 1782 to 378 ms. 79% of the time during which the page could not respond to a finger was created neither by our code nor by the animation.
The real culprit
There were four tags in the <head>, all four the standard ones an owner installs and forgets: an analytics counter, an ad platform tag and two social-network pixels. All with the async attribute, all "non-blocking". Around 600 KB of third-party JavaScript in total.
Then came the thing this section is worth reading for. A 189 KB counter library was downloaded and executed twice.
The reason is mundane. We have two identifiers — analytics and advertising. For each, the platform issues a ready-made snippet with its own loading line, and the owner dutifully pastes both. But the library in them is one and the same: it serves every identifier through separate configuration calls. The second copy adds nothing — it is simply downloaded again, parsed again and executed again on that same slow mobile processor.
If you have both analytics and an ad account from the same platform, there is a good chance you have the same picture. It takes a minute to check — the method is in step 3 below.
Why "async" does not save you
This is the second place where intuition misleads. The async attribute means: "do not hold up HTML parsing, download in parallel." It honestly does its job — the page renders without waiting for the tag.
But once the file has downloaded, it still has to be executed, and it executes on the same single main thread that answers taps. async removes the parsing block but not the thread's busyness — and INP measures precisely that. Hence the familiar situation: the page appeared fast, every counter is "asynchronous", and the metric is red.
One more trap: deferral alone changes nothing
The obvious fix is to defer the tags until the browser is free. That is what we did. And measured.
Blocking time after deferral alone came to 2101 ms against 2026 ms before — that is, slightly worse. The logic is simple: deferring moves the work in time, it does not remove it. The work has not gone anywhere, it just runs later — sometimes exactly when the person has already started tapping the screen.
What worked was something else: removing the second copy of the library. After that, blocking time fell to 1775 ms, and everything else followed — first paint from 1128 to 824 ms, server response from 669 to 335 ms.
What to do with your own site: six steps
Below is an order in which each step makes sense after the previous one. Each comes with a check showing you have passed it.
Confirm the problem is yours
Open the Core Web Vitals section in Search Console and look at the mobile tab separately from the desktop one. Separately is the point: "phone red, desktop green" is the most common form of this problem, and looking only at the summary makes it easy to miss.
If the mobile tab is green, you can stop reading — you do not have this problem.
Measure instead of guessing
The main mistake at this step is to start switching off whatever looks heavy. We nearly switched off an animation that had nothing to do with it. Measure three variants of the same page: as is, without the suspect, and without third-party tags.
The most accessible way is Chrome DevTools: the Performance tab, CPU throttling at 4× with mobile emulation, record 10–15 seconds of the page's life and look at the long tasks. They are highlighted, and each one shows which file produced it.
Check whether one library loads twice
This is the cheapest win on the list. Open the Network tab in DevTools, filter by js and scan the list: is the same file name there twice with different parameters in the address?
The typical case is an analytics counter and an ad tag from the same platform: different snippets, one file. Keep a single loading line, and set the second identifier up as a separate configuration call. Nothing is lost: the library serves both.
<!-- before: two snippets, the same library twice -->
<script async src="…/tag.js?id=ID-1"></script>
<script async src="…/tag.js?id=ID-2"></script>

<!-- after: one library, as many identifiers as you need -->
<script async src="…/tag.js?id=ID-1"></script>
<script>
  config('ID-1');
  config('ID-2');
</script>
Defer the tags without losing a single event
Only after step 3 — because deferral on its own does not help, as we measured. In combination, though, it frees up the critical first seconds.
The idea: move the external files out of <head> and load them on the first of three events — the main thread going idle, a 3-second timeout, or the first touch on the screen. Touch is mandatory in that list: if the person is already interacting with the page, the tag is needed immediately, otherwise you lose exactly the active session.
Events are not lost in the process, and this is the key detail. Tiny stub functions stay in <head> and queue every call; when the library finally loads, it replays the queue in full. That is how these snippets are designed — the queue is provided for by their own authors.
Re-measure, and do not expect instant green
After release, repeat the measurement from step 2 — you should see blocking time drop. The Search Console report, however, will not turn green at once: it is built on data from real visitors over a rolling window and updates with a lag of weeks.
That is normal and not a reason to roll the fix back or stack a second one on top. The lab measurement says it got better, so the field will confirm it later.
If it did not help — the reserve
Once the third-party tags are in order and the metric is still off, the next moves, in descending order of payoff: redundant counters that duplicate each other's purpose; unused CSS (on our home page 92% of the rules never apply); HTML caching, if the page is served with no cache at all.
Separately, it is worth asking honestly whether you need every counter you have connected. Each one is somebody else's code running on your visitor's phone while they wait for a tap to register.
What not to do
In short
"Not effective on mobile while desktop is green" almost always means one thing: the page is busy executing somebody else's code on a phone's slow processor. In our case third-party tags accounted for 79% of blocking time, and the most expensive small detail turned out to be a second copy of the same 189 KB library — loaded simply because the snippet is copied once per account.
If you do one thing right now: open the Network tab on your own site and see whether some counter file is being downloaded twice. It is a one-minute check, and it is free.
The crawl reports heavy pages, blocking scripts and the rest of the technical findings — split by severity.
Frequently asked questions
What is INP in plain words?
It is the time from touching the screen to the moment the page visibly responds. Google counts 200 ms or less as good and more than 500 ms as poor. The metric assesses responsiveness, not loading speed: a page can open fast and still take a long time to answer a tap.
Why is a site not effective on mobile but effective on desktop?
Because a phone's processor is four to eight times slower than a desktop one. The same script that runs unnoticed in 60 ms on a computer stretches to 300–500 ms on a phone, and the person sees the delay. The code is identical — only the speed of running it differs.
Is it true that analytics slows a site down?
In our measurement third-party tags accounted for 79% of main-thread blocking time: 1782 ms with them against 378 ms without. That is not a reason to remove analytics altogether, but it is a reason to check how many tags you have, whether they duplicate each other, and when exactly they load.
Does async help on an analytics script?
Partly. The async attribute removes the HTML parsing block, so the page renders sooner. But the downloaded file still executes on the main thread, and INP measures that thread's busyness. An async script can spoil the metric just as an ordinary one does.
Can you defer counters without losing conversions?
Yes, if you leave stub functions in the head that queue calls until the library loads — that is how these snippets are designed. Be sure to include the first touch among the events that trigger loading, otherwise you can lose an active session. After release, verify that events are arriving.
How long until the Search Console report turns green after a fix?
Not immediately. The metric is collected from real visitors over a rolling window and updates with a lag of weeks. Rely on your own lab measurement: if blocking time has fallen, the field will confirm it later.
Sources
PromoPilot's own measurement, 28 August 2026: Pixel 5 emulation with the CPU throttled 4×, observation of long tasks and of tap latency on the live site.
web.dev, INP documentation: the definition, the good / needs improvement / poor thresholds, and the field nature of the measurement.
Google Search Console, the Core Web Vitals report: separate tabs for mobile and desktop devices.