What we saw on our own site: a month of organic traffic to promopilot.link
Over 28 days, Google clicks to promopilot.link went from 218 to 435 and impressions from 13,078 to 20,855. Here are the Search Console numbers, everything we did at the same time, and what we cannot conclude from them: the cause of growth and the share of cascades.
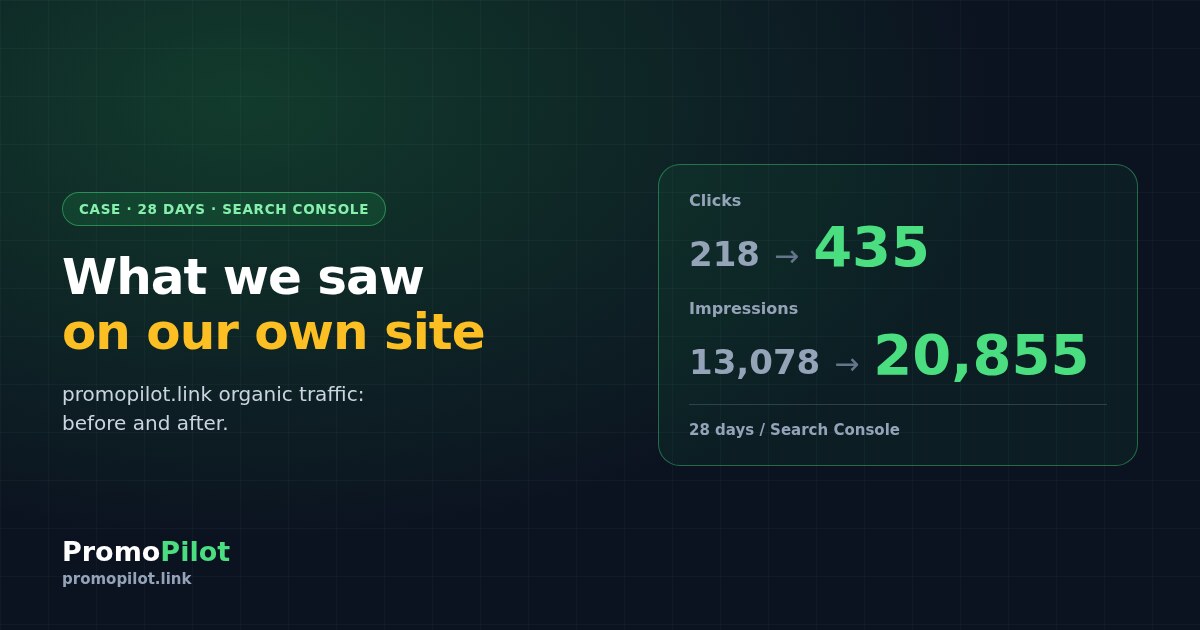
In short: over 28 days, Google clicks to promopilot.link went from 218 to 435, and impressions from 13,078 to 20,855. That is what we saw in Search Console. We can't say what exactly worked, because too many things changed at once. Below: the numbers, a list of everything we did in parallel, and the limits of what this shows.
The numbers
We compare two 28-day windows in Google Search Console (property https://promopilot.link/).
| Period (28 days) | Clicks | Impressions |
|---|---|---|
| Before: 26 Aug – 22 Sep 2026 | 218 | 13,078 |
| After: 23 Sep – 20 Oct 2026 | 435 | 20,855 |
| Change | +100% | +59% |
Most of the growth came in the last days: in early October we got 6–10 clicks a day, on 15 Oct 35, on 19 Oct 39, on 20 Oct 47. Daily impressions went from roughly 450 to roughly 2,100.
Where the clicks came from
- Tool pages (/tools/): 370 of 435 clicks, or 85%. The watermark detectors lead: the Russian watermark-detector page got 97 clicks, the English audio-watermark-detector page 71.
- Knowledge base: 25 clicks. Blog: 16. Home page: 15.
- Page languages: ru 229, en 116, uk 47, pl 41.
- Countries: Russia 166, Ukraine 84, Poland 42, USA 26.
The takeaway is small but useful: nearly all the traffic is not the brand or the home page, but individual tool pages matching a specific query.
What we did in parallel
During these weeks we ran a lot of work at once (about 20 "waves"):
- launched new tools, including 42 new English pages;
- rewrote articles and updated meta tags;
- reworked internal linking;
- fixed x-default in hreflang;
- ran cascade promotion to tool pages: 28 launches (10 Basic cascades to English pages on 12–16 Oct, six more on 13 Oct and 12 more on 17 Oct). A Basic cascade starts from $30. All of this ran on top of regular content work, not instead of it.
What we cannot claim
This is why the title says "what we saw", not "what it gave us".
- We can't isolate the effect of the cascades. They ran in the same weeks as everything else, and we have no control group of pages. Plainly: we don't know how much of the growth relates to cascades and how much to new pages, meta tags or something else.
- The site is young and its authority is low (DR about 6). Small numbers swing a lot: 435 clicks is a small sample.
- Search results are unstable. Industry data points to volatility in Google on 20–21 Oct, and the last day of the window may fall into it.
- Google may have sent part of the clicks to AI overviews, so impressions don't always turn into visits.
- Links and content usually take 1.5–4 months to show their effect. One month of data is not a trend.
What hasn't worked yet
Of the 42 new English tool pages, 24 still have no impressions: judging by Search Console, Google isn't showing them yet. We had linked to them only from the side menu. On 22 Oct we added links from the home page and submitted indexing requests. We'll check again in a few weeks.
How to find such pages on your own site
You can ask your own site the same questions: which pages already get impressions but almost no clicks, and which get no impressions at all. These are the underrated pages. SEO Radar helps find them and explains what's wrong with each. A broken link check shows whether your internal linking is losing pages you just added. Start with one step and change one thing at a time: that way you can at least see what moved the numbers.