A Search Console lesson: 8 questions about your site and where to find each answer
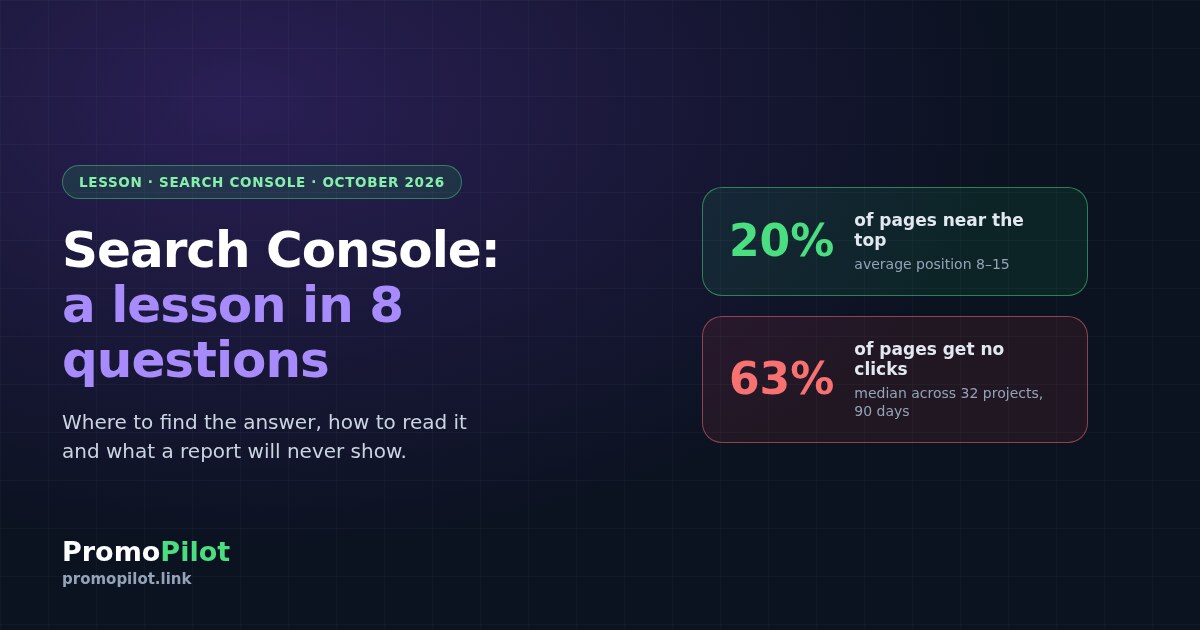
Search Console is the most accurate free source of data on how Google sees a site, yet people usually read it in a panic, and read the wrong numbers. This lesson covers eight questions site owners ask and, for each, where Search Console holds the answer, how to read it and what the report will not show. Plus data from 32 projects: 63% of pages get no clicks, and one in five sits near the top.
Search Console is the free and most accurate source of data on how Google sees your site. But people usually open it in a panic, when something has dropped, and read the wrong numbers. This lesson is built differently: eight questions site owners actually ask, and for each one — where Search Console holds the answer, how to read it, and what that report will never show. Everything has been checked against Google's documentation as of October 2026, and where it helps, we add data from our clients' real sites.
Before you start: three rules for reading the data
Half of the wrong conclusions drawn from Search Console come not from tricky cases but from three simple things.
Question 1. Is the site actually growing?
Where to look: Performance → Search results. Compare periods of equal length with the compare button — it allows one comparison at a time and immediately shows a difference column.
The first setting worth switching on is the branded queries filter. Since 11 March 2026 it has been available to all eligible sites. Queries are classified not by a regular expression but by an AI-assisted Google system: it covers your brand name in all languages, misspellings and even queries about your unique products that do not include the brand name. Branded traffic shows how many people already know you; non-branded shows how many new people you attract from search. Real SEO growth is the non-branded part.
Question 2. Which pages are almost in the top?
Where to look: the same report, the Pages tab, then Queries filtered by page. Look for pages with many impressions and low CTR at an average position of roughly 8 to 15.
In our data these pages are on average one in five. And this is the cheapest growth there is: the gap between positions is large. The median CTR of pages at positions 4–10 is 1.3%; at positions 11–20 it is 0.7%. Moving a page from the second results page to the first nearly doubles clicks for the same impressions.
A regular expression filter is handy for finding queries. Search Console uses RE2 syntax; matching is partial and case-insensitive by default. For example, all questions:
^(how|what|why|when|which|is|can)or all commercial queries:
(buy|price|cost|cheap|order|best)Question 3. Why is a page not in the index?
Where to look: Indexing → Pages. The report splits addresses into indexed and not indexed and gives a reason for the latter. The most important thing to know in advance, Google puts itself: "Don't expect every URL on your site to be indexed".
| Status | What it means | What to do |
|---|---|---|
| Crawled — currently not indexed | Google crawled the page but did not index it. No need to resubmit it. | Work on the page's value and the internal links pointing to it |
| Discovered — currently not indexed | Google knows the address but has not crawled it yet: the crawl was rescheduled to avoid overloading the site. | Check server speed and the number of unnecessary URLs |
| Duplicate without user-selected canonical | Google treated the page as a duplicate and chose the main one itself. | Set the canonical explicitly or merge the pages |
| Alternate page with proper canonical tag | The alternate version correctly points to the main one. | Nothing — this is how it should be |
| Soft 404 | The page says “not found” but returns status 200. | Return a real 404 or give the page content |
| Excluded by noindex / Blocked by robots.txt | You blocked indexing yourself. | Make sure the block is intentional |
A detailed breakdown on our own data is in the article on why half of a site can be out of the index.
Question 4. Does the site show up in AI answers?
Where to look: the Generative AI report in the performance section. It shows impressions only — no clicks, CTR or queries — and is a subset of the Web search type. Clicks from AI Overviews are included in the regular report, but cannot be separated there. If the report is empty, check the Search generative AI setting: with “Exclude” the site is excluded from AI features and there will be no data.
More in our breakdown of the Generative AI report. And recently another AI trace has appeared in Search Console: for a small number of publishers it runs a pilot that pays for contributing to AI answers — what is known about it.
Question 5. Do people search for you with a camera?
Where to look: Performance → search type. Since 24 September 2026 there is a separate option for multimodal search: Google Lens, Circle to Search, uploading an image to search, and Chrome's “Search this image”. For online stores, product sites and visual guides this is a new channel that used to be invisible. More on multimodal reporting.
Question 6. Who links to you?
Where to look: Links. Three tables: top linked pages, top linking sites and top linking text. The report has three limitations worth remembering. It is a sample, not a full list: Google calls it "not a comprehensive list". Tables are cut at 1,000 rows, exports at 100,000. And the report does not distinguish regular links from nofollow.
Question 7. Are there problems Google warns about itself?
Where to look: Security & Manual actions — manual actions and security issues. If there is anything here, everything else is secondary. Next in importance is Core Web Vitals: the report is built on data from real visitors, not lab measurements, so changes show up in it with a delay. We described how to deal with mobile metrics in our piece on mobile INP and analytics tags.
Question 8. What does Google see on a specific page?
Where to look: URL Inspection — the search bar at the top of Search Console. The tool shows two different things: how Google saw the page at the last crawl, and how it sees it right now — via the live test button. Comparing the two answers the question “why doesn't Google see my changes”. You can also request indexing there, but requests have a daily quota and do not guarantee indexing.
The most common mistake: average position
Average position in Search Console is the topmost position of the site or page in each query, averaged across all queries. It changes not only when you move up or down, but also when the set of queries changes: new queries at distant positions appear — and “average position” gets worse even though the site has grown.
We ran into the same trap while preparing this lesson. We wanted to show the real CTR at position one on our clients' data — and found that 88% of impressions at position 1 and 97% at positions 2–3 come from a single site. Any aggregate figure would describe that site, not the market. The lesson is simple: before drawing a conclusion from a total, look at what it is made of.
A 15-minute weekly routine
Security and manual actions
One minute: empty — move on. Not empty — everything else waits.
Non-branded traffic, last 28 days against the previous 28
Compare equal periods, apply the non-branded filter, ignore the last three days.
Pages with the largest click loss
The Pages tab, sorted by click difference. Usually the entire drop sits in one or two pages.
New reasons for non-indexing
The Pages report: have new reasons appeared, or has an existing one jumped?
The near-the-top list
Once a month, refresh the list of pages at positions 8–15 and mark which have already been strengthened.
Frequently asked questions
Why doesn't the sum of the table rows match the chart total?
Because Google hides rare queries for privacy — those asked by fewer than a few dozen people over two to three months. They are missing from the tables but included in the chart totals. Another reason is the different aggregation of data by site and by page.
How long does Search Console keep data?
Performance data is kept for 16 months. If you need a longer history, export the data regularly through the API or connect it to third-party tools while it is still available.
What is the branded queries filter and where is it?
It is a filter in the performance report that splits queries into branded and non-branded. Classification is done by an AI-assisted Google system rather than a regular expression, so it accounts for misspellings and your product names. Since 11 March 2026 it has been available to all eligible sites, and it does not affect ranking.
Why is a page marked “crawled, currently not indexed”?
Google crawled it but decided not to add it to the index — most often because of low value or similarity to other pages. Resubmitting such a page is pointless. Work on its content and the internal links pointing to it.
Does Search Console show all links to a site?
No. The Links report is a sample, its tables are cut at 1,000 rows and exports are capped at 100,000. The report also does not distinguish regular links from nofollow. It is good for trends and anchors, not for auditing individual links.
Can I see clicks from AI answers in Search Console?
Not separately. Clicks from AI Overviews and AI Mode are part of the regular performance report and are not broken out, while the Generative AI report shows impressions only. You can find out that the site appears in AI answers; how many visits that brings, you cannot.
Sources: Google Search Console Help (performance report, filtering and comparison, Pages report, Links report, multimodal and generative reports), Google Search Central Blog: “A deep dive into Search Console performance data filtering and limits” (2022), “Introducing the branded queries filter in Search Console” (2025, updated 11 March 2026). Own data: daily page-level Search Console exports for PromoPilot clients over the 90 days to 5 October 2026, 32 projects; client domains are not named.