Pulse: live dynamics for every link — positions, indexing and profile strength
Each link shows its best growing metric; one click opens a chart with cascade events, a 0–99 score and domain metrics. Everything is calculated automatically.
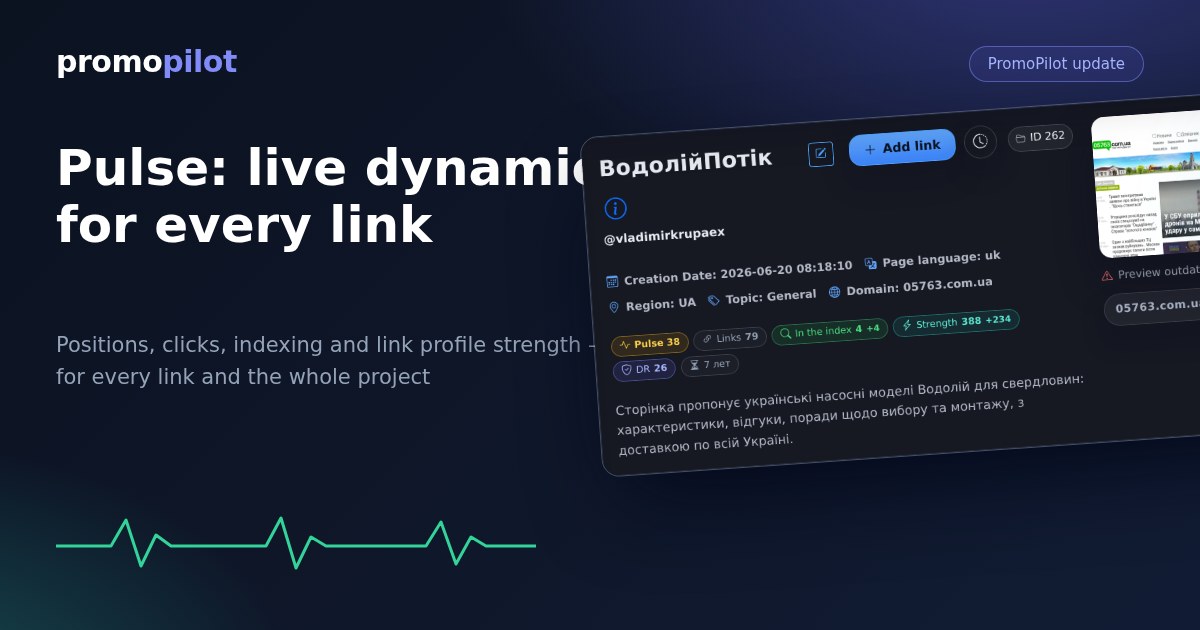
Meet Pulse — live promotion dynamics for every link and every project, right inside your PromoPilot dashboard. Positions and clicks from Search Console, visits from GA4, publication indexing, link profile strength, Domain Rating and domain age — everything is calculated automatically every night and shown exactly where you make decisions: in the links table, on the project card and on the dashboard.
Why we built it
Until now the dashboard honestly showed the process: how many publications were made, what was verified, what got indexed. But the client's main question is different: "what did it actually give me?" Now the answer is visible instantly — no Search Console exports, no third-party tools. Pulse collects daily history for every promoted page and turns it into clear badges and charts.
The Pulse column: each link shows its best growing metric
There is a new column in the project links table. Next to each link the system shows whichever metric is growing for that specific link right now: position for one, clicks for another, new search queries or freshly indexed pages for a third.

Priority always goes to the most valuable signal: position → clicks → visits → queries → impressions → indexing → profile strength. There are noise thresholds too: a fraction-of-a-percent change will never become a badge — only real movements do.
The modal: a chart with events, a timeline and a 0–99 score
Click a badge to see the full picture: an interactive chart with switchable metrics, a Pulse score ring from 0 to 99 and a timeline of promotion events.

The key feature is events right on the chart. Vertical markers show cascade launches and completions, indexing bursts and milestones like "page entered the top 10". Hover over a marker to see what happened that day; click an event in the timeline and we highlight it on the chart. That makes the most important thing visible: how metrics change after a cascade launch. If several cascades were launched for one link, they are merged into a single timeline and numbered — "Cascade #2 launched", "Cascade #2 completed".
Project-level dynamics — on the dashboard too
The project header now carries a row of colored badges: overall Pulse, 28-day clicks and impressions, links built and how many are indexed, link profile strength, DR and domain age.

Two badges are smart. "Near the top" collects pages ranking 4–20 where a cascade brings the fastest effect. "Time to reinforce" catches links where the effect of a past cascade is fading. Both are clickable: press one to see the exact pages, and clicking a row opens its Pulse instantly. Compact dynamics badges also appeared in the project list on the dashboard — the whole portfolio status at a glance.
Where the data comes from — and why it's honest
- Your cascades. The history of publications, verification and indexing is stored on our side — so link profile charts were built retroactively, across the entire project history.
- Google Search Console and GA4. Connect Google in one click to add positions, clicks, impressions, query counts and visits for every page. Daily history accumulates automatically.
- Domain metrics. Domain Rating by Ahrefs, domain age from registry data and the date of the first appearance in the web archive.
How to enable it
You don't have to — it's already live. Open your dashboard or any project: the badges are there and history accumulates every night. One tip: if you haven't connected Search Console yet, do it — Pulse will shine at full strength with positions, clicks and queries for every page. And Radar will use the same data to suggest which pages to promote next.
More is coming: Pulse will arrive in the mobile app, and domains will get PromoPilot's own independent rating.