Google Search Console in 2026: What to Check (38 Sites)
"Google Search Console" is searched about 4 million times a month worldwide (up 49% over a year), 90,500 times in Poland (up 83%) and 27,000 times in Ukraine (up 22%). Most people who open it see a dozen menu items and no instructions. This guide goes through the reports one by one: where to…
"Google Search Console" is searched about 4 million times a month worldwide (up 49% over a year), 90,500 times in Poland (up 83%) and 27,000 times in Ukraine (up 22%). Most people who open it see a dozen menu items and no instructions. This guide goes through the reports one by one: where to click, what to look at, what it means, what to do. At each step we add what we see in the anonymized Search Console data of 38 small and medium sites connected to PromoPilot (October 2026). A typical site there has most of its queries outside the first page, so the report you will probably get the most from is the one for positions 11–30. Caveat: 38 sites that chose to connect Search Console to us are not a random sample of the web, so the numbers describe this group only.
Data: anonymized Google Search Console data of 38 sites connected to PromoPilot, October 2026; shares of queries for the 27 sites with at least 20 queries; aggregates only
Key numbers
- A typical site in our group (median of 38) had 94 queries with impressions in the month, 401.5 impressions and 2 clicks. Its average position was 32.7.
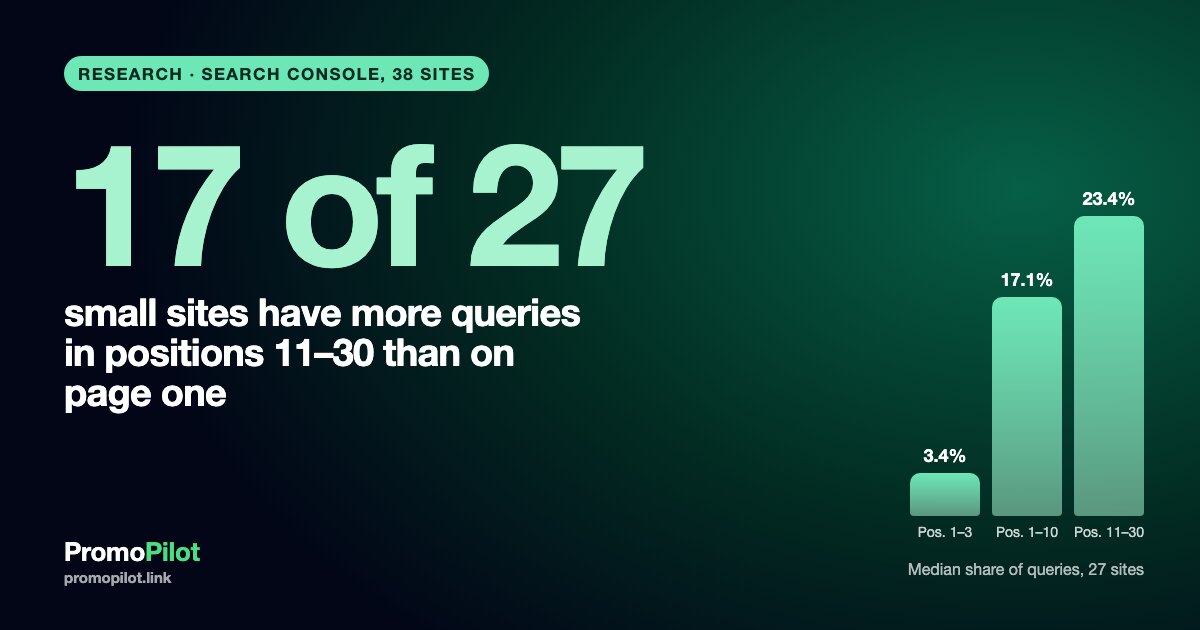
- For the 27 sites with at least 20 queries, the median share of queries in positions 1–3 is 3.4%, in positions 1–10 (page one) 17.1%, in positions 11–30 23.4%. These are separate medians and do not add up.
- 17 of these 27 sites (63%) have more queries in positions 11–30 than in positions 1–10.
- Median CTR by the site-month's average position: 1–10 is 2.14% (21 site-months, little data), 10.1–20 is 1.82% (51), 20.1–40 is 0.55% (155), over 40 is 0% (144).
- Demand (Google Ads, monthly): "google search console" about 4 million worldwide (+49% year over year), Poland 90,500 (+83%), Ukraine 27,000 (+22%).
Before you start: what Search Console is and what to set up
Search Console is Google's free tool that shows how your site appears in Google Search: which queries bring impressions and clicks, which pages Google has indexed, and which technical problems it found. It shows Google's own data, which no third-party tool can fully replace, but only for sites you have proven you own.
- Add the site. You will be asked to choose between a domain property (covers all subdomains and both http and https) and a URL-prefix property (one exact address). A domain property is the more complete view; a URL-prefix property is easier to verify. If you can, use the domain property.
- Verify ownership with the method Search Console offers (a DNS record, an HTML file, a meta tag or a linked Google account). Keep the verification in place: if it is removed, you lose access.
- Submit your sitemap (step 3 below) and wait. Data starts to appear after a few days, not at once, and the Performance report keeps a limited history (Google states 16 months), so connect early to keep your history.
- Add the right people. Give colleagues and agencies access through user rights inside Search Console instead of sharing a login.
Menu names and layout change from time to time, so below we describe reports by what they do. If a label differs on your screen, look for the report with the same purpose.
Step 1. Performance: queries, pages, countries, devices, search appearance
Where to click. Open the Performance report for search results. Above the chart you will see clicks, impressions, average CTR and average position, a date range and filters. Below the chart there are tabs for queries, pages, countries, devices and search appearance.
What the four numbers mean. Impressions: how many times a result from your site was shown. Clicks: how many times it was clicked. CTR: clicks divided by impressions. Position: the average place of your site's result, where 1 is the first place on the page. Position is an average over everything that was shown, so one page can be at position 3 for one query and 40 for another.
What to look at, tab by tab:
- Queries. The words people typed before they saw your site. Sort by impressions to see what you are visible for, and by clicks to see what actually brings visits. Queries with many impressions and few clicks need a closer look (see step 2).
- Pages. Which URLs get impressions and clicks. Click a page and then switch to the queries tab: you will see which queries that page is shown for. This is the fastest way to check what a page is about in Google's eyes.
- Countries. Where the impressions come from. If many come from a country you do not serve, the page language or targeting may not match your audience. If you are growing in a country you did not plan for, that is information too.
- Devices. Computer, mobile, tablet. A big gap in CTR or position between mobile and desktop is a reason to open the page on a phone and see what a visitor sees.
- Search appearance. Results shown with special features, if any are detected for your site. Check it if you use structured data or similar markup; it is empty when nothing applies.
- Dates. Use the comparison mode (this period against the previous one) and compare full weeks or months, not single days. Data lags by a day or two.
A note on newer reporting. Google has said that its newer AI-based search features are counted in the Performance report together with other search results. We do not analyze them here. If your account shows a separate view or filter for them, treat it as extra context and check Google's current documentation for what it includes.
What to do. Set up one routine: last 28 days against the previous 28, queries and pages, once a week. Write down the five pages with the most impressions and the five queries you most want to grow. Do not react to a one-day change.
Limits to remember. The tables show a limited number of rows in the interface, and rare, privacy-sensitive queries are not shown, so the sum of rows can be lower than the total. For more rows, use the export or the Search Console API.
Step 2. Positions 11–30: the report where most small sites have their work
Where to click. In Performance, open the queries tab, turn on the average position column and sort or filter so that you see queries with a position between 11 and 30 and a meaningful number of impressions. If the interface does not give you the filter you want, export the table and filter it in a spreadsheet.
What it means. A query with an average position of 11–20 is on the second page of results; 21–30 is the third page. Google already considers your page relevant enough to show it, but few people look beyond the first page, so these queries bring impressions and few clicks. In our group of sites this is not a corner case, it is the typical picture:
| Measure (median across sites) | Value |
|---|---|
| Queries with impressions per site (all 38 sites) | 94 |
| Share of queries in positions 1–3 | 3.4% |
| Share of queries in positions 1–10 (page one) | 17.1% |
| Share of queries in positions 11–30 | 23.4% |
| Sites with more queries in 11–30 than in 1–10 | 17 of 27 (63%) |


Why look here and not at the first page? Because CTR differs sharply by position. In our data the median CTR for site-months with an average position of 1–10 is 2.14% (21 site-months, little data) and for 10.1–20 it is 1.82%, but for 20.1–40 it falls to 0.55% and over 40 the median is zero clicks. The groups are small, so read this as an illustration of the shape, not as a rule: CTR depends on the query, the snippet and the type of results around you.
| Average position of the site-month | Site-months | Median CTR |
|---|---|---|
| 1–10 | 21 | 2.14% |
| 10.1–20 | 51 | 1.82% |
| 20.1–40 | 155 | 0.55% |
| Over 40 | 144 | 0% |

What to do with the list. It is a to-do list, not a promise of anything. For each page that appears in it:
- Open the page and the query side by side. Does the page answer exactly this query, on the first screen?
- Compare the title and the description with what you see for similar queries. Is the main phrase in the title? Would you click on it?
- Check which other pages of your site might compete for the same query (the pages tab, filtered by the query). Two pages for one query often split the signal.
- Add internal links to the page from related pages, with a clear anchor text.
- Re-check in a few weeks. Positions move for many reasons, and a change is not proof of what caused it.
To see a position today rather than the monthly average, use our free Google rank checker. A longer walkthrough of this method, including how to build the list, is in our guide to striking-distance keywords in Search Console.
Step 3. Sitemaps
Where to click. The Sitemaps report in the indexing section of the menu.
What to look at. The list of submitted sitemaps, the date of the last read, the status and the number of discovered pages. Any parsing error is listed.
What it means. A sitemap is a hint to Google about which URLs you want crawled. A successful status means that Google read the file, not that every listed page is indexed. A "couldn't fetch" status or a parsing error means that the address is wrong, blocked or the file is not valid XML.
What to do. Submit the final address of the sitemap (not one that redirects) and keep only canonical, indexable pages in it. To check the file before you submit it, use the Sitemap Analyzer, and see what a crawler gets from robots.txt with the robots.txt checker. We examined sitemaps on 5,071 sites separately in our sitemap study.
Step 4. Pages (indexing)
Where to click. The page indexing report in the indexing section.
What to look at. The chart of indexed and not indexed pages and, under it, the list of reasons why pages are not indexed. Click a reason to see example URLs.
What it means. Not every "not indexed" page is a problem. Pages you deliberately block, redirects, duplicates with a canonical tag and pages marked noindex are normal. A problem is a page you want in search that sits under a reason such as "crawled, currently not indexed", "discovered, currently not indexed", a server error, a blocked resource or a wrongly set canonical. Google's wording for the reasons changes from time to time, so read the description next to each one.
What to do.
- Sort the reasons by the number of pages and start with the ones that include pages you care about.
- For each important URL, open it in the URL inspection tool (step 9) to see Google's view of it.
- Fix the cause (server errors, redirects, noindex by mistake, thin or duplicate content, no internal links) before you ask for a re-check. The validate-fix button in the report starts a recheck of that group.
- To check many addresses in bulk outside Search Console, our site index checker can help.
Step 5. Core Web Vitals and page experience
Where to click. The Core Web Vitals report in the experience section, with separate views for mobile and desktop.
What to look at. Groups of URLs marked as good, needing improvement or poor, and the metric that causes it (loading, responsiveness, visual stability).
What it means. The report is built from real-user data collected from Chrome users, so a small or new site may have no data at all, and the report will say that there is not enough. This is not a fault. The data is grouped, so one template problem can affect hundreds of URLs at once.
What to do. Take the worst group, open one URL from it in a page speed test, fix the largest cause (a heavy image, a slow server, a script that blocks rendering) and use the validate button after the fix. Do not expect a quick change in the report: it reflects a rolling period of real visits.
Step 6. HTTPS
Where to click. The HTTPS report in the experience section (if it is available for your property).
What to look at. The numbers of HTTPS and non-HTTPS URLs and the reasons for the non-HTTPS ones, such as a redirect that does not lead to https, a certificate problem or mixed content.
What to do. Make http addresses redirect to https in one step, and check the certificate and its renewal date with the SSL checker. Check the redirect chain with the redirect checker.
Step 7. Links
Where to click. The Links report.
What to look at. External links: the pages of your site that are linked most, the sites that link to you most and the most common link text. Internal links: which of your pages receive the most links from your own site.
What it means. This is Google's own sample, not a complete list, and numbers can differ from other backlink tools. Use it to see which pages attract links and which important pages have few internal links.
What to do. Add internal links to pages that matter and that appear in step 2 (positions 11–30) but have few links in the internal list. Look through the linking sites for anything unexpected.
Step 8. Manual actions and Security issues
Where to click. The manual actions and security issues reports. They are usually empty, and that is what you want.
What it means. A manual action means that a person at Google reviewed the site and found a violation of its spam policies; the report names the issue and the affected pages. A security issue means that Google detected hacked content, malware or similar. Either one can reduce visibility sharply, and this is the first place to look after a sudden drop that a seasonal pattern does not explain.
What to do. If there is something there, follow the description, fix the cause and only then send a review request. Turn on email notifications so that you do not discover it weeks later.
Step 9. URL inspection
Where to click. The inspection field above the report: paste a full URL of your site.
What to look at. Whether the URL is in Google's index, when it was last crawled, which canonical Google chose, whether the page may be indexed and which structured data was detected. The live test fetches the page now and shows how Google sees it.
What it means. If Google chose a different canonical than the one you declared, it considers another page a duplicate or the stronger version. If the live test is fine but the indexed version is old, the page has not been recrawled yet.
What to do. After you fix or publish an important page, use the request for indexing for that URL. It is a request, not a command: Google does not promise to index the page, and repeating it does not help.
How often to look: a routine you can keep
| How often | Report | Question to answer |
|---|---|---|
| Weekly | Performance, queries and pages, 28 days against the previous 28 | What grew, what fell, which queries are in positions 11–30? |
| Weekly | Manual actions, Security issues (or email alerts) | Is it still empty? |
| Monthly | Pages (indexing), Sitemaps | Did the number of important pages that are not indexed grow? Any new reason? |
| Monthly | Core Web Vitals, HTTPS | Did a group of URLs get worse after a release? |
| After each important publication or change | URL inspection | Does Google see the page the way you intended? |
| Quarterly | Links, Performance by countries and devices | Any unexpected shift in who links to you and where visitors come from? |
What we saw in the data of 38 sites
We summed up the Search Console data of 38 sites connected to PromoPilot for October 2026, without any domains. The group is small and not random: these are mostly small and medium sites, and their owners chose to connect Search Console. A typical site (median) had 94 queries with impressions, 401.5 impressions and 2 clicks, with an average position of 32.7. For the 27 sites with at least 20 queries, 3.4% of queries were in positions 1–3, 17.1% in positions 1–10 and 23.4% in positions 11–30, and 17 of the 27 had more queries in positions 11–30 than in 1–10.
How to read this: a typical small site is visible in Google for many queries but mostly outside page one, so traffic is low relative to visibility. That is why steps 1 and 2 are the most practical place to start for such a site. It does not follow that moving queries from 11–30 to page one is easy or certain, and we do not claim that any action will raise rankings. The data only says where the largest pool of queries is that you could examine.
Methodology and limits
The data are anonymized aggregates from Google Search Console of 38 sites whose owners connected Search Console to PromoPilot, for October 2026 (the CTR table uses site-months of the same sites). For each site we took the number of queries with impressions, impressions, clicks, the average position and the share of queries by position bucket. Medians are taken across sites; the share of queries by position bucket only for the 27 sites with at least 20 queries, so that a handful of queries does not decide the share. For the CTR table the unit is the site-month, groups are formed by the site's average position in that month, and each group has at least 20 site-months.
Limits: the group is small, not random and consists of sites that connected Search Console to us, so it should not be generalized to all sites. An average position is an average over all queries and pages, not the place of a particular result. Search Console does not show rare queries, so the real number of queries is higher than the one in the report. Medians of separate measures do not add up. CTR figures are medians over site-months and not the CTR of a single query. The data contains no client names and no domains. The demand figures are Google Ads monthly volumes, rounded by Google. The aggregates are published as CSV under CC BY 4.0.
FAQ
What is Google Search Console used for?
It shows how your site appears in Google Search: the queries and pages that get impressions and clicks, indexing status, sitemaps, page experience data, links, and security or manual action messages. It is free and shows Google's own data for sites you have verified.
Which Search Console reports should I check first?
Start with Performance (queries and pages), then Pages (indexing) and Sitemaps. Keep Manual actions and Security issues on notification so that you hear about a problem at once. Core Web Vitals, HTTPS and Links can be checked monthly or quarterly.
How do I find queries in positions 11–20 in Search Console?
Open Performance, go to the queries tab, show the position column and filter or sort to positions between 11 and 20 with a meaningful number of impressions. If the interface does not give the filter you want, export the table and filter it in a spreadsheet.
Why are my impressions high and clicks low?
Most often the result is on the second page or lower, or the snippet does not match the query. In our group of 38 sites the median site had 401.5 impressions and 2 clicks a month, and the median CTR was 0.55% for site-months with an average position of 20.1–40. Check the position first, then the title and description.
How long does it take for data to appear in Search Console?
Usually a few days after verification, and the Performance report runs a day or two behind. History is limited (Google states 16 months), so connect Search Console as early as you can.
Does Search Console improve my rankings?
No, it is a reporting tool: it shows what Google sees and reports. It does not change rankings by itself, and we do not claim that using it raises them. What matters is what you change on the site after reading it.
Sources
- Google Search Console: search.google.com/search-console
- Google Search Console Help, Performance report: support.google.com
- Google Search Console Help, Page indexing report: support.google.com
- Google Search Central documentation: developers.google.com/search/docs
How to cite
PromoPilot (2026). Google Search Console in 2026: which reports to check and what to do with them, with data from 38 sites. Data October 2026. CC BY 4.0: https://promopilot.link/uploads/blog/research/search-console-guide-2111/gsc-38-sites-oct-2026.csv . Article: https://promopilot.link/en/blog/google-search-console-reports-guide-38-sites-2026
Download the data
The aggregate tables (CSV, license CC BY 4.0): https://promopilot.link/uploads/blog/research/search-console-guide-2111/gsc-38-sites-oct-2026.csv. It contains aggregates only, no projects, domains or client data.
Median CTR by average position (CSV, site-months, June 2025 – November 2026)