Half of 75,960 Researched Keywords Lost 20%+ Demand, 2026
Half of the keywords in our base lost at least 20% of their search volume in one year: 51.6% of 75,960. The median keyword changed by −21.1%, yet total demand in the sample is up 3.0%, because a tiny group grew a lot. These…
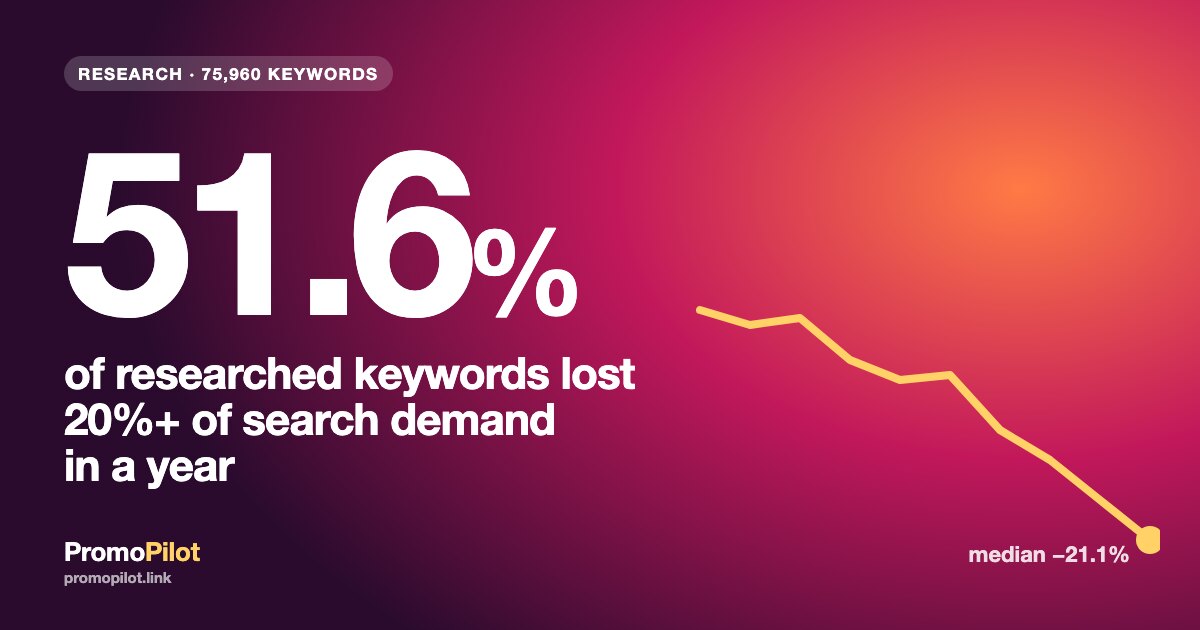
Half of the keywords in our base lost at least 20% of their search volume in one year: 51.6% of 75,960. The median keyword changed by −21.1%, yet total demand in the sample is up 3.0%, because a tiny group grew a lot. These are keywords that SEO specialists researched, often at a moment of peak interest, so part of the decline may be a return to the normal level. It is not the whole of Google, and we say below what the base can and cannot show.
Data: 75,960 keywords, Google Ads monthly volume, October 2024 – September 2026, snapshot November 13, 2026
Key numbers
- 51.6% of keywords (39,222 of 75,960) lost at least 20% of their annual search volume, and the median change is −21.1%. Base: 75,960 unique keywords researched by SEO specialists, with at least 10 searches a month in year one, Google Ads monthly volume, October 2024 – September 2025 vs October 2025 – September 2026.
- 18.4% lost more than half of their volume (13,985 keywords), and 1.4% (1,079) show zero in Google Ads for July – September 2026 (the zero may be a display threshold, not an absence of searches). Only 16.4% grew by 20% or more, and 5.5% doubled or better (same base and period).
- Total volume of the sample is still +3.0%: 1% of keywords (759) produced 96.7% of all growth. Without them, the volume of the other 75,201 keywords fell by 18.9%. More than 40% of the sample (42.9%) is the US, so the total is close to the US picture (same base and period).
- The long tail loses more often: 31.1% of one-word keywords lost 20% or more, against 58.3% of keywords with five or more words. By volume: 32.5% of keywords with 10,000+ searches a month, 54.5% of those with 100–999 (same base and period).
- Markets differ a lot: 59.5% of en-GB keywords (1,959) and 58.3% of en-US (32,583) lost 20% or more, against 26.3% of pl-PL (1,947), where 32.8% grew (same base and period; markets with at least 1,000 keywords).
How many keywords lost demand: the overall picture

For each keyword we added up 12 months of Google Ads volume for October 2024 – September 2025 and for October 2025 – September 2026, then compared the two sums. Annual sums remove seasonality: a winter keyword is compared with the same winter keyword. We then sorted every keyword into six classes.
| Class | Share of keywords |
|---|---|
| Zero in Google Ads (July – September 2026) | 1.4% |
| Lost 50% or more (not zero) | 17.0% |
| Lost 20–50% | 33.3% |
| Within ±20% | 32.0% |
| Grew 20–100% | 10.8% |
| Doubled or more | 5.5% |
Classes 1–3 together are the 51.6% that lost at least 20%. Classes 5 and 6 together are the 16.4% that grew by 20% or more. So for every keyword that grew noticeably, about three lost noticeably. About a third (32.0%) stayed within ±20%.
Long tail against head

The more words in a keyword, the more often it lost demand. For one-word keywords the share is 31.1% (4,398 keywords), for two words 42.5% (18,306), for three 54.4% (23,171), for four 57.9% (16,168), for five or more 58.3% (13,917). The step is largest between one and three words, then it flattens.
Volume tells a similar story. Table 2 groups keywords by their average monthly volume in year one.
| Searches per month | Keywords | Lost 20% or more | Grew 20% or more |
|---|---|---|---|
| 10–99 | 43,826 | 52.4% | 17.9% |
| 100–999 | 21,770 | 54.5% | 13.9% |
| 1,000–9,999 | 7,280 | 46.6% | 14.3% |
| 10,000+ | 3,084 | 32.5% | 17.9% |
Mid-volume keywords (100–999 a month) lost demand most often, 54.5%, while the biggest ones (10,000+) fell least often, 32.5%. Short head keywords look steadier than long ones, but note the base: it holds only 4,398 one-word keywords and 3,084 keywords with 10,000+ searches, much fewer than the long tail.
Does the gap come only from volume? We checked: inside each volume band, one-word keywords still lose demand less often than keywords of five or more words (Table 3).
| Searches per month | One word | Five or more words |
|---|---|---|
| 10–99 | 33.9% | 57.2% |
| 100–999 | 40.1% | 61.5% |
| 1,000–9,999 | 29.9% | 59.8% |
| 10,000+ | 20.3% | 52.1% |
The gap holds in every band, from 23 points at 10–99 searches to 32 points at 10,000+. Volume alone does not explain it. Why longer keywords fall more often we did not measure.
Markets

A market here is the language and geography pair set for the keyword in our tool. Table 4 shows the markets with at least 1,000 keywords.
| Market | Keywords | Lost 20% or more | Grew 20% or more |
|---|---|---|---|
| en-GB | 1,959 | 59.5% | 7.7% |
| en-US | 32,583 | 58.3% | 14.2% |
| it-IT | 1,056 | 54.0% | 9.8% |
| es (international) | 1,494 | 52.9% | 8.5% |
| ru (international) | 6,170 | 51.0% | 14.0% |
| uk-UA | 21,133 | 46.1% | 20.1% |
| en (international) | 3,473 | 43.7% | 18.4% |
| es-ES | 2,349 | 41.5% | 23.0% |
| pl-PL | 1,947 | 26.3% | 32.8% |
The English-speaking markets of the UK and US are at the top: 59.5% and 58.3% lost at least 20%, and only 7.7% and 14.2% grew. Poland is the opposite: 26.3% lost, 32.8% grew, so more keywords grew than fell. Ukraine (46.1% against 20.1%) and Spain (41.5% against 23.0%) sit between them. Why the markets differ we did not measure.
1% of keywords made 96.7% of growth
Total volume in the sample is +3.0% year on year, which looks like stability. It is not. The median keyword changed by −21.1%, and the total stays positive only because a tiny group grew a lot: 1% of keywords produced 96.7% of all growth. Without those 759 keywords, the volume of the other 75,201 fell by 18.9%. And more than 40% of the sample (42.9%) is the US, so the total is close to the US picture. A total over a whole keyword list is therefore a poor guide to a typical keyword in it.
What this means in practice
- Refresh keyword lists at least once a year. A list built a year ago likely contains many keywords that lost a fifth or more of their volume.
- Before writing a page, look at the 24-month trend of the keyword, not only the latest monthly number. The latest number can sit on a peak or on a slump.
- Check demand for long-tail pages on a schedule. In our base, keywords with three or more words lost demand more often than short ones.
- Judge a list by its median and by the share of keywords that fell, not only by its total volume. A positive total can hide a shrinking majority.
- Do not draw conclusions about the reason from these numbers alone. The data shows that demand in Google Ads fell, not why.
To check the trend of your own keywords, try our keyword research tool. Our earlier research on what people check in free SEO tools is here.
Methodology and limits
Source: the PromoPilot keyword base, meaning keywords our users researched in keyword tools, with monthly Google Ads search volume for 24 months, October 2024 – September 2026, snapshot November 13, 2026. Only aggregates are published, with no projects or domains. Near-identical variants that Google Ads reports with the same volume were merged: keywords with the same language, market and 24-month series count as one (96,941 series remained of 132,845). The base includes keywords with a full 24-month series and an average of at least 10 searches a month in year one (annual sum of 120 or more): 75,960. Change is (sum for October 2025 – September 2026 minus sum for October 2024 – September 2025) divided by the year-one sum. Classes: fell to zero (zero in July – September 2026 or in all of year two), lost 50% or more, lost 20–50%, within ±20%, grew 20–100%, doubled or more. Markets are the language and geography pair from the keyword settings, shown from 1,000 keywords.
Limits. This is not a random sample of all keywords. Users often research a keyword at a moment of peak interest, so part of the decline may be a return to the normal level, not a lasting fall. Google Ads rounds volume into buckets (for example 1,300, 1,600, 1,900), so changes at low volumes are stepwise. The en-US market is 43% of the base, so the total over the sample leans toward it. Zero in Google Ads may be a display threshold, not a complete absence of searches. We did not measure why demand falls. Possible factors include answers from AI assistants and AI Overviews, shifts in how people word queries, and changes in Google Ads data itself, but this data cannot tell them apart or prove any of them. The data is aggregated, no individual sites or queries are published.
FAQ
How many keywords lost search demand in a year?
51.6% of 75,960 keywords that SEO specialists researched (39,222) lost at least 20% of their Google Ads volume, comparing October 2025 – September 2026 with October 2024 – September 2025. The median change was −21.1%. Users often research keywords at peak interest, so part of this may be a return to normal. It is not all of Google.
Does falling volume mean my page will lose traffic?
Not necessarily. Volume is the number of searches, not traffic to a page. A page's traffic depends on many other things, and we did not study it. Falling volume is a reason to check a keyword's trend, not a verdict on the page.
Why is total volume up 3.0% if most keywords fell?
Because 1% of keywords (759) produced 96.7% of all growth. Without them, the other 75,201 fell by 18.9% in total. The median keyword fell by 21.1%, and 42.9% of the sample is the US. A total over a list says little about a typical keyword.
Do long-tail keywords lose demand more often than short ones?
In this base, yes: 58.3% of keywords with five or more words lost 20% or more, against 31.1% of one-word keywords. The gap holds inside every volume band (for example 20.3% against 52.1% at 10,000+ searches a month). Treat it as a pattern in our data.
Why did demand fall: AI answers?
We did not measure the cause, so we do not claim one. Possible factors include AI answers and AI Overviews, changes in how people word queries, and changes in Google Ads data. This data cannot separate them. Part of the decline may also be regression to normal, since users often research keywords at peak interest.
Can I download the data?
Yes. The aggregate CSV (by change class, word count, volume and market) is under CC BY 4.0, with no individual projects or domains. The link is in the "Download the data" section below.
How to cite
PromoPilot (2026). How many keywords lost search demand in a year: 75,960 keywords. Data October 2024 – September 2026. CC BY 4.0: https://promopilot.link/uploads/blog/research/keywords-decline-1511/keyword-demand-change-2026-11.csv . Article: https://promopilot.link/en/blog/keywords-losing-search-demand-75960-keywords-2026
Download the data
The aggregate table (CSV, license CC BY 4.0): https://promopilot.link/uploads/blog/research/keywords-decline-1511/keyword-demand-change-2026-11.csv. It contains aggregates by change class, word count, volume and market, no individual projects or domains.