Key facts
Website response time check: enter an address and see the DNS, connect, TLS and TTFB (time to first byte) times in milliseconds and an A–F grade. Free. It is one measurement from our server: it shows how fast the server answers, not how the page loads in a visitor’s browser.
- Price
- Free
- Sign-up
- Not required
- Processing
- On our server: it makes one GET request to the page and measures DNS, connection, TLS, time to first byte (TTFB) and the full HTML download
- Input
- A page address (http or https)
- Limits
- 20 checks per minute per IP, no sign-up and no daily limit; a 30-second timeout; up to 5 redirects
- Output
- DNS, connect, TLS, TTFB and total load times in milliseconds, the downloaded HTML size, speed and an A–F grade based on TTFB
- Last updated
See it in action
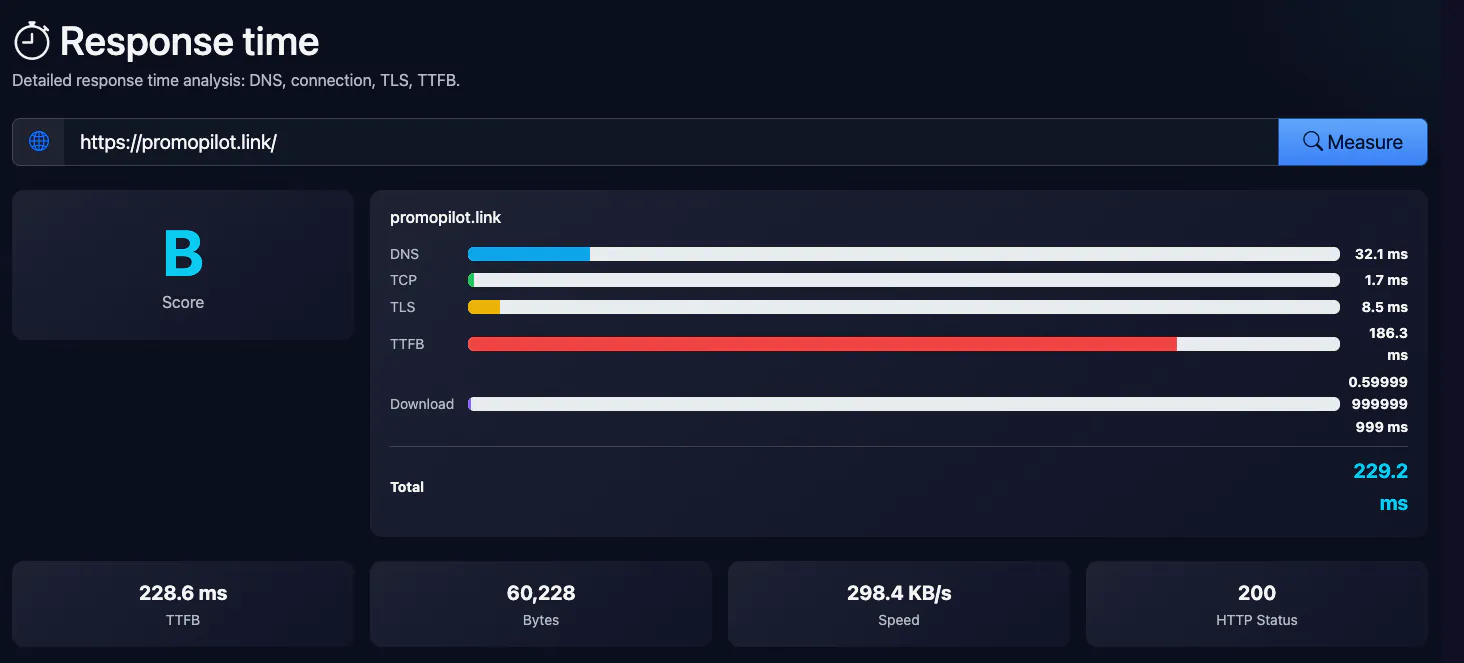
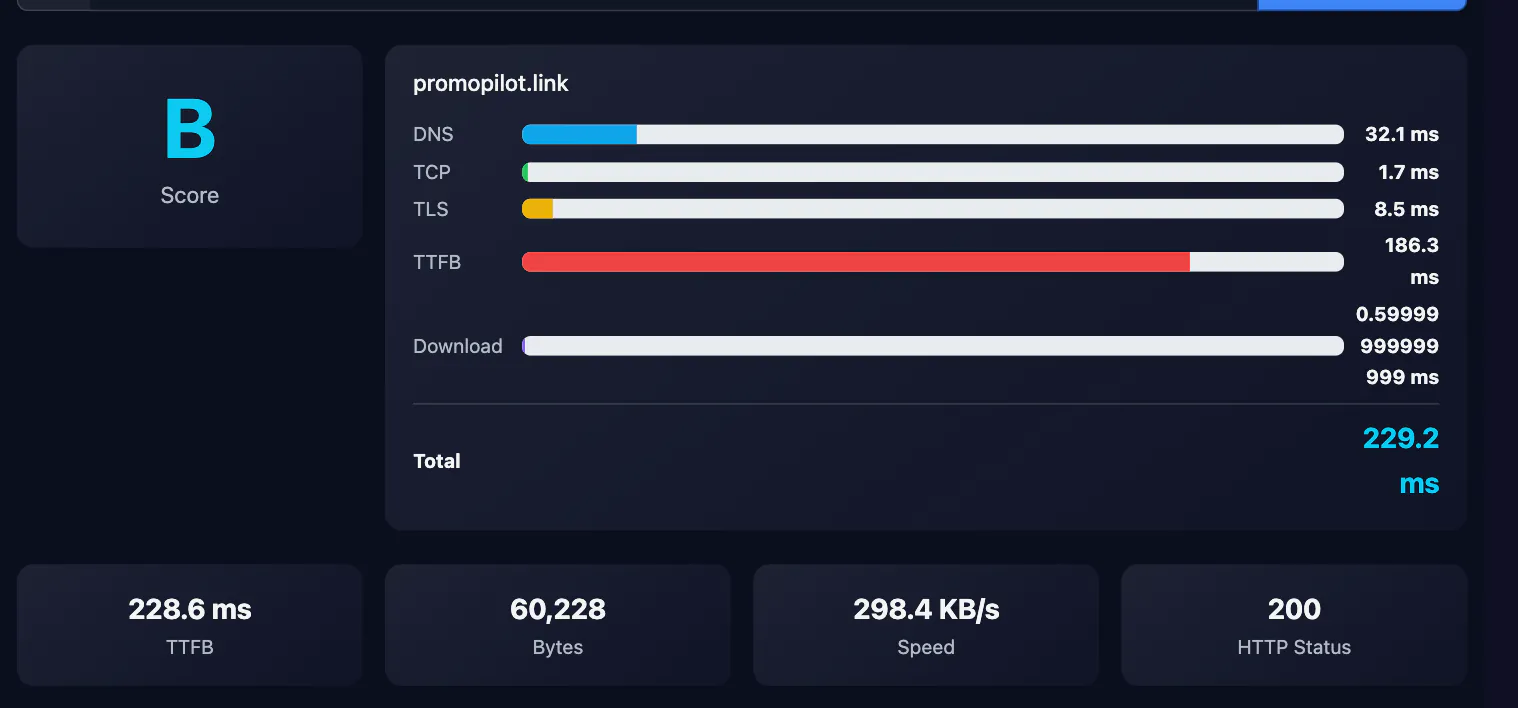
Response time measurement
Measure server response time by stage: DNS (from our server, not a visitor), connection, TLS handshake and TTFB. A single measurement from our server, with no repeats. Response time affects Core Web Vitals and Google rankings.
How to Use
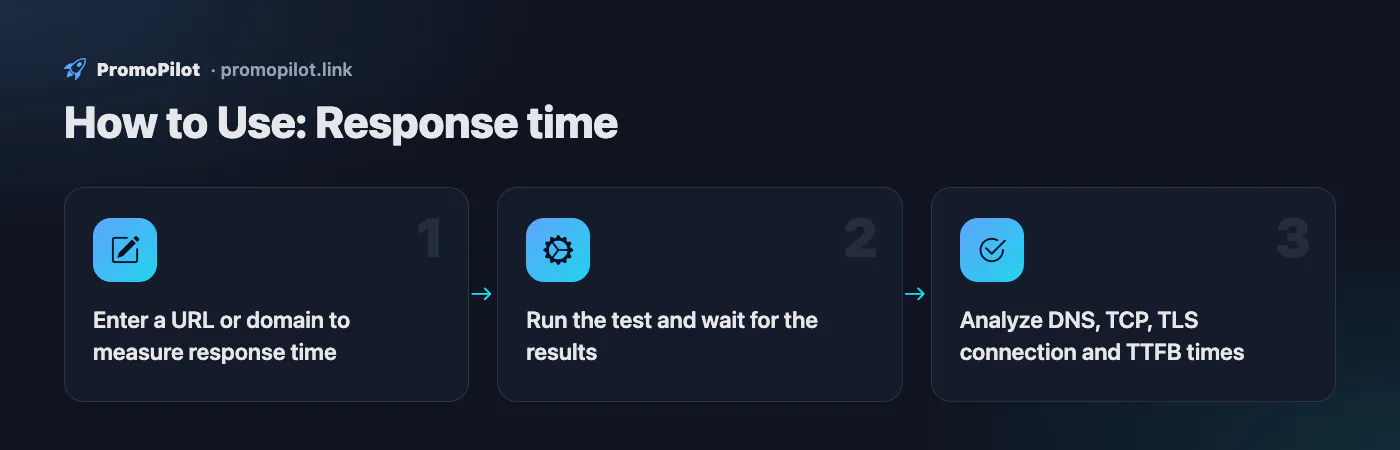
- Enter a URL or domain to measure response time
- Run the test and wait for the results
- Analyze DNS, TCP, TLS connection and TTFB times
FAQ
Who it is for and typical uses
- A slow server. If TTFB is large while DNS and TLS are fast, the problem is the backend itself: code, database, cache.
- Comparing hosts and CDNs. Measure the same URL before and after a move or after enabling caching.
- Checking after changes. Confirm that code or cache optimisation shortened the time to first byte.
- The scale in short. TTFB under 200 ms gets an A, 200–500 ms a B, then C, D and F; these are our own thresholds.
Honest limitations
- One sample from one place. It depends on the distance to our server and current network load; a repeat may differ. You cannot pick a region.
- HTML only. One document is downloaded, without images, scripts or styles, so the full page load in a browser will be longer. For that see the website grader and PageSpeed Insights.
- The A–F grade uses TTFB only. Connect time, TLS and page size are not part of it.
- The first request may be cold. The server or CDN cache is often empty for the first request, so repeat the check.
- DNS time is ours. It is the name-resolution time on our server, not your visitors’.
Related: is the site up, compression, HTTP/2, hosting checker.
PromoPilot vs alternatives: comparison
We compare only what is confirmed on each service's own pages. Where we could not confirm a fact, the cell shows "—".
| Parameter | PromoPilot | KeyCDN Performance Test | Google PageSpeed Insights |
|---|---|---|---|
| DNS / connect / TLS / TTFB breakdown | ✓ | ✓ DNS, Connect, TLS, TTFB and HTTP response headers | — |
| Several test locations | ✗ one location | ✓ 10 locations around the world | — |
| Real-user data | ✗ | — | ✓ Chrome UX Report field data (LCP, CLS, INP, FCP); lab data from Lighthouse |
Scroll the table sideways
Where we are weaker: a single measurement from one place, HTML only, no repeated probes or averaging, and no history or monitoring.
When to choose PromoPilot: When you want to quickly measure how fast a server starts answering and see which stage (DNS, TLS or the server itself) is slow. For measurements from different countries and real-user data you need other services.
Checked on: . "—" means not confirmed on the official page; terms and prices change, so check the services' own sites.